.png)
How to Benchmark Employee Benefits Against Competitors
Benefits benchmarking is the practice of comparing your employee benefits packages directly against those of your actual talent competitors using segment-specific data on costs, plan design, and employee value perceptions. For HR professionals and business leaders, this process is the foundation of a competitive total rewards strategy. The KFF 2025 Employer Health Benefits Survey sets the national baseline: average annual premiums reached $9,325 for single coverage and $26,993 for family coverage. Knowing where your offerings stand relative to that baseline, and more importantly relative to the companies competing for the same candidates, is how you close talent gaps before they cost you hires.
How to benchmark employee benefits competitors: start with the right peer group
The single most common mistake in benefits benchmarking is measuring your packages against national averages. National benefit statistics are nearly useless for mid-market employers because regional labor markets, carrier leverage, and plan designs vary widely, affecting both pricing and perceived competitiveness. A 200-person professional services firm in Austin competes for talent against other mid-sized firms in Austin, not against Fortune 500 companies nationwide.
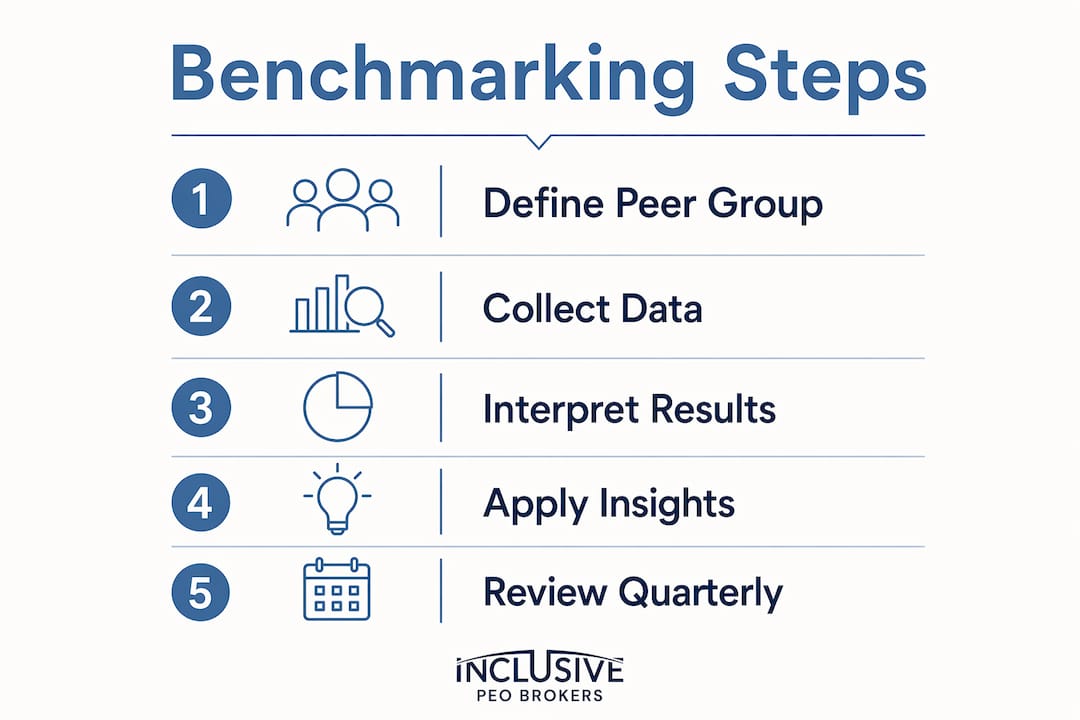
Your peer group should include 10 to 20 employers you genuinely compete with for the same candidates. Three filters define that group:
- Sector: Stick to your industry or adjacent industries where skills transfer easily. A software company recruiting engineers competes with other tech firms, not with manufacturing plants.
- Geography: Prioritize employers within your primary hiring radius. Remote-first companies expand this to national competitors for specific roles.
- Company size: Segment by headcount band (for example, 50 to 250 employees) because plan pricing, carrier access, and benefit generosity all shift significantly across size bands.
Effective benchmarking requires selecting a peer group based on talent competitors rather than national averages, producing defensible insights that align with recruitment realities. Once you have your peer list, use sources like Gallagher’s annual survey, LinkedIn Talent Insights, and direct job posting analysis to surface what competitors are advertising in their benefits packages.
Pro Tip: Review the benefits sections of your top 10 competitors’ career pages quarterly. Job postings increasingly list specific perks and contribution levels, giving you real-time competitor intelligence without a paid data subscription.
What data points should you collect for an employee benefits comparison?
Effective competitor benchmarking goes well beyond comparing monthly premium totals. Plan design elements such as deductibles, out-of-pocket maximums, and copays must be collected and segmented by employee category to avoid misleading conclusions. Two plans with identical employer premium contributions can produce dramatically different financial experiences for employees depending on their deductible structure.

Collect data across these core categories for each competitor in your peer group:
| Data Category | What to Collect |
|---|---|
| Employer premium contribution | Percentage paid for single, spouse, and family tiers |
| Out-of-pocket cost structure | Annual deductible, copay amounts, coinsurance rate, OOP maximum |
| Retirement benefits | 401(k) match formula, vesting schedule, employer contribution type |
| Voluntary benefits | Dental, vision, life, disability, FSA/HSA availability and employer seed amounts |
| Leave and absence management | PTO accrual rate, parental leave weeks, sick leave policy |
Employers covered an average of 84% of single coverage premiums and 74% of family coverage premiums in 2025. These figures represent the competitive baseline your contribution rates will be measured against. Falling meaningfully below 84% on single coverage signals a gap that candidates will notice during offer comparisons.
Segmentation matters as much as the data itself. Offer rates fall to 60% for lower-paid workers compared to 80% for the broader workforce, which means your benchmarking analysis should separate salaried and hourly employee populations. A benefits package that looks competitive for your management team may be significantly below market for your frontline staff.
Pro Tip: Build a simple spreadsheet matrix with each competitor as a column and each data point as a row. Fill in what you can find publicly, then use broker relationships and survey data from sources like Gallagher’s benchmarking report to fill gaps. This matrix becomes your living benchmarking document.
How do you interpret benchmarking data beyond headline costs?
Collecting data is the straightforward part. Interpreting it accurately is where most benchmarking efforts fall short. Employee cost exposure, meaning the combined weight of premium share plus out-of-pocket risk, drives perceived benefit competitiveness more than headline employer costs alone. A competitor paying a lower percentage of premiums but offering a $500 deductible plan may be perceived as more generous than your plan with a higher employer contribution but a $3,000 deductible.
Use a two-step interpretation process. First, compare your employer contribution percentages against your peer group benchmarks. Second, layer in the plan design features to assess total employee financial exposure across a typical year. This gives you a true generosity score rather than a surface-level cost comparison.
When weighting which benefits gaps to prioritize, employee preference data is your guide. Health insurance and paid time off are valued by 63% of US workers each, making them the two categories where competitive gaps hurt recruiting the most. Gaps in voluntary benefits like dental or vision matter, but they rarely drive offer rejections the way health plan cost exposure does.
Watch for these common interpretation pitfalls:
- Comparing averages to your specific workforce: A benchmark showing competitors offer 10 days of PTO means little if your workforce skews toward employees with 10-plus years of tenure who expect 20 days.
- Ignoring participation rates: A benefit your employees rarely use is not a competitive advantage, even if the plan design looks generous on paper.
- Treating all roles the same: Engineers, sales staff, and administrative employees often have different benefit priorities. A single composite benchmark misses these distinctions.
An internal benchmarking scoring model that balances recruiting impact, cost impact, and execution risk produces more useful strategy insights than superficial plan comparisons. Build a simple scoring rubric that rates each identified gap on those three dimensions before deciding where to invest.
How to apply benchmarking insights to improve your benefits strategy
Benchmarking data only creates value when it drives decisions. The translation from analysis to action follows a clear sequence. Start by ranking identified gaps using your scoring rubric, then build a phased improvement plan that addresses the highest-impact gaps first without overextending your benefits budget in a single plan year.
- Prioritize health plan cost exposure gaps first. If your employee deductible or out-of-pocket maximum is significantly above your peer group median, address that before adding new voluntary benefits. Candidates compare total financial risk, not just premium contributions.
- Adjust contribution tiers strategically. If your family coverage contribution falls below the 74% employer average, consider increasing it incrementally. Even a 3 to 5 percentage point improvement can shift your position relative to competitors without a dramatic budget increase.
- Add high-visibility, lower-cost benefits. Voluntary benefits like legal assistance plans, pet insurance, or mental health apps carry low employer cost but high perceived value. These fill gaps in your benefits catalog without major budget commitments.
- Incorporate benchmarking into your talent acquisition messaging. Once you have closed key gaps, make that visible. Update your careers page, offer letter templates, and recruiter talking points to reflect your competitive standing. Candidates who receive competing offers will compare packages, and your team needs to be equipped to make that comparison favorable.
- Schedule annual benchmarking reviews. Benefits competitiveness is not static. Gallagher’s 4,000-organization survey updates annually and covers medical, pharmacy, voluntary benefits, and absence management. Build a calendar reminder to refresh your benchmarking matrix each fall before your open enrollment planning cycle begins.
Working with a broker or PEO partner who has access to proprietary benchmarking data accelerates this process significantly. Brokers with mid-market specialization often have peer group data that is not publicly available, giving you a more accurate picture of what your specific competitors are actually offering rather than what they advertise. You can explore how to reduce healthcare costs while maintaining competitive plan designs as part of this strategy.
Pro Tip: When presenting benchmarking findings to leadership, frame gaps in recruiting cost terms. If a benefits gap causes you to lose one mid-level hire per quarter to a competitor, calculate the replacement cost of that role (typically 50 to 200% of annual salary) and compare it to the cost of closing the gap. The math usually makes the investment obvious.
Key takeaways
Benchmarking competitor employee benefits produces defensible, actionable results only when you compare against your actual talent competitor set using segment-specific plan design data, not national averages.
| Point | Details |
|---|---|
| Define your peer group first | Use sector, geography, and size filters to build a list of 10 to 20 true talent competitors. |
| Collect plan design details | Gather deductibles, OOP maximums, and contribution tiers, not just premium totals. |
| Segment by employee category | Separate salaried and hourly populations because offer rates and plan designs differ significantly. |
| Weight by employee preference | Prioritize health insurance and PTO gaps first, as 63% of workers value each most. |
| Score gaps before investing | Rank improvements by recruiting impact, cost, and execution complexity before committing budget. |
Why most benefits benchmarking misses the point
I have reviewed benefits benchmarking exercises for dozens of small and mid-sized businesses, and the pattern is consistent. Companies spend weeks pulling together data, then compare themselves to national averages published by large survey houses and conclude they are “roughly competitive.” That conclusion is almost always wrong, and it is wrong in a specific direction: it makes employers feel more competitive than they actually are in their local talent market.
The peer group problem is the root cause. National averages include large employers with significant purchasing power, union contracts, and benefits budgets that bear no resemblance to what a 150-person company in a mid-sized metro can realistically offer. When you strip out those outliers and compare yourself only to the companies your candidates are actually choosing between, the gaps become much clearer and much more specific.
The second mistake I see consistently is treating benchmarking as a one-time project. Benefits markets shift every year. Voluntary benefits that were differentiators in 2023 are table stakes in 2026. Absence management programs, which Gallagher now tracks across 4,000-plus organizations, have moved from a nice-to-have to a genuine recruiting factor in many industries. If your benchmarking data is more than 18 months old, you are making strategy decisions on stale intelligence.
The businesses that get this right treat benchmarking as an ongoing discipline, not a one-time audit. They maintain a living peer group matrix, refresh it annually, and use it to make incremental improvements that compound over time. That approach, paired with a first-time PEO selection process that includes built-in benchmarking support, is what separates employers who consistently win talent from those who wonder why their offer acceptance rates are declining.
— John
How Inclusive PEO Brokers can help you compete on benefits
Benchmarking your benefits against competitors is only half the equation. Acting on what you find requires the right HR infrastructure and expert guidance to execute plan changes efficiently.

Inclusive PEO Brokers specializes in matching small and mid-sized businesses with Professional Employer Organizations that provide access to Fortune 500-level benefits, built-in benchmarking data, and ongoing plan optimization. Their clients save an average of 80 hours in the PEO selection process and $634 in direct costs, backed by 133 successful implementations. If your benchmarking analysis has revealed gaps you need to close, explore Inclusive’s PEO services to see how a PEO partnership can give you the purchasing power and data access to compete on benefits with employers twice your size.
FAQ
What does it mean to benchmark employee benefits against competitors?
Benefits benchmarking means comparing your plan designs, employer contribution rates, and total rewards packages against a defined group of employers competing for the same talent. The goal is to identify gaps that affect your ability to attract and retain employees.
How many companies should be in my benchmarking peer group?
A peer group of 10 to 20 employers filtered by industry, geography, and company size produces the most relevant results. Comparing against national averages misleads mid-market employers because regional and size-based differences are significant.
What is the average employer contribution to health insurance premiums?
Employers covered 84% of single coverage and 74% of family coverage premiums on average in 2025. These figures serve as the competitive baseline for evaluating your own contribution rates.
Which employee benefits matter most to job seekers?
Health insurance and paid vacation are each valued by 63% of US workers, making them the highest-priority categories to benchmark and close gaps in before addressing secondary benefits.
How often should you update your benefits benchmarking data?
Annual updates aligned with your open enrollment planning cycle are the minimum. Benefits markets shift each year, and data older than 18 months may no longer reflect what your actual talent competitors are currently offering.
Recommended
.svg)
Seeking a different solution? Meet Your Business Needs