.png)

PEO Health Insurance Cost for SMBs: What to Expect

For most small businesses with fewer than 50 employees, joining a PEO’s health plan lowers the per-employee premium compared to buying a direct group policy, but the net employer cost depends on how you account for the PEO’s administrative fee. According to the 2024 Employer Health Benefits Survey by KFF, the average employer contribution for single coverage and family coverage are at benchmarks typically reported in recent years.
The components that determine your net cost:
- Premium change: Whether the PEO’s pooled rate beats your current carrier quote (or renewal)
- PEO admin fee: The PEPM or payroll-percentage charge on top of pass-through premiums
- HR time recovered: Hours your team stops spending on benefits admin, compliance filings, and open enrollment
- Workers’ compensation: PEOs often access lower workers’ comp rates through their own master policies
- Compliance risk transfer: ACA reporting, COBRA administration, and ERISA obligations shift to the PEO under co-employment
The math rarely favors or disfavors a PEO universally. Your workforce age mix, headcount, state, and current plan design all move the needle. The sections below walk through each variable with worked examples and a due-diligence checklist you can use during vendor conversations.
Key Takeaways
PEO health insurance can lower per-employee premiums for small businesses, but the net employer cost depends on the admin fee, workforce demographics, and a multi-year view of pool renewal history.
| Point | Details |
|---|---|
| National premium benchmark | KFF reports average employer cost of $7,869/year for single coverage and $22,463 for family coverage in 2024. |
| Admin fee range | PEO administrative fees typically run $100–$200 PEPM or 2–12% of gross payroll, billed on top of pass-through premiums. |
| Multi-year comparison matters | Evaluate total employer cost per enrolled employee across three years, not just Year 1 premium, to account for pool renewal volatility. |
| Best fit for PEO health plans | Companies under 50 employees with limited HR capacity and multi-state workforces tend to benefit most from PEO pooling. |
| Inclusive PEO Brokers | Clients save approximately 80 hours in the selection process and achieve an average cost saving of $634 through brokered PEO matching. |
Table of Contents
- What is PEO health insurance, and how does the master policy work?
- How does PEO pricing actually work?
- What factors drive how much your PEO plan will cost?
- How to estimate your total employer cost under a PEO
- What are the real benefits and tradeoffs of PEO health insurance?
- What should you ask a PEO before signing?
- Are there better alternatives to PEO health insurance?
- How Inclusive PEO Brokers models outcomes for clients
- The part most cost guides get wrong about PEO health insurance
- How Inclusive PEO Brokers helps you find the right fit
- Sources
What is PEO health insurance, and how does the master policy work?
A Professional Employer Organization (PEO) enters a co-employment relationship with your business. Under that arrangement, your employees are technically co-employed by both your company and the PEO. The PEO becomes the employer of record for tax and benefits purposes, which lets it enroll your workforce into its own master health plan rather than a standalone group policy tied to your EIN.
The master policy is the key mechanism. Instead of your 12 or 30 employees forming their own risk pool, they join a pool that may include tens of thousands of workers across many client companies. Carriers price that larger pool differently than a small standalone group, which is where the premium advantage for small employers often comes from. NAPEO’s industry research documents this pooled purchasing structure as a defining feature of the PEO model.
A few practical implications of the master policy structure:
- ACA reporting: The PEO files ACA employer mandate reports (Forms 1094-C and 1095-C) under its own EIN, not yours. The HHS overview of the Affordable Care Act outlines the employer responsibilities that shift when a PEO acts as plan sponsor.
- COBRA administration: When an employee separates, COBRA notices and continuation coverage are administered by the PEO, not your HR team.
- Plan sponsorship: The PEO is the plan sponsor, which means it holds fiduciary responsibility for plan documents, SPDs, and ERISA compliance.
What is bundled versus billed separately varies by vendor, but the general pattern looks like this:
- Bundled in the admin fee: Payroll processing, HR platform access, benefits administration, compliance support, and sometimes workers’ comp
- Billed as pass-through costs: Carrier premiums (health, dental, vision), employee contributions, and ancillary benefit premiums
- Sometimes extra: Implementation fees, COBRA administration fees, platform upgrade tiers, and ACA filing charges
How does PEO pricing actually work?
PEOs use three primary billing structures, and understanding which one a vendor uses changes how you read their quote.
Per-employee-per-month (PEPM): A flat dollar amount charged for each enrolled employee each month, regardless of salary. This model is the most predictable for budgeting because your admin cost scales with headcount, not payroll. PEPM fees typically run $100–$200 per employee per month for full-service PEOs, though bare-bones platforms can come in lower. For a deeper breakdown of what those fees include, the PEO administrative fees guide explains how to read a PEPM schedule line by line.
It scales with compensation, so a salary increase for one employee raises your admin cost even if your headcount stays flat. High-wage workforces pay more under this model than under PEPM.
Flat fee: Less common, usually offered to very small firms or as a promotional structure. It simplifies billing but can obscure per-employee economics when headcount changes.
Pass-through premiums: Carrier premiums are almost always billed separately from the admin fee, passed through at cost (or sometimes with a small markup). Always confirm in writing whether premiums are marked up before you sign.
Where hidden charges tend to appear:
- One-time implementation or onboarding fees ($500–$2,500 is a common range)
- COBRA administration fees per qualifying event
- Ancillary benefit premiums (dental, vision, life, disability) billed outside the health premium line
- Platform or technology upgrade tiers
- Off-cycle payroll run fees
Pro Tip: When comparing PEO proposals, ask every vendor to provide a complete PEPM fee schedule that separates the admin fee from carrier premiums and ancillary costs. A quote that bundles everything into one per-employee number makes year-over-year comparison almost impossible.
What factors drive how much your PEO plan will cost?
No two companies land at the same PEO health insurance cost, even with identical headcounts. The variables below are the ones that move the number most.
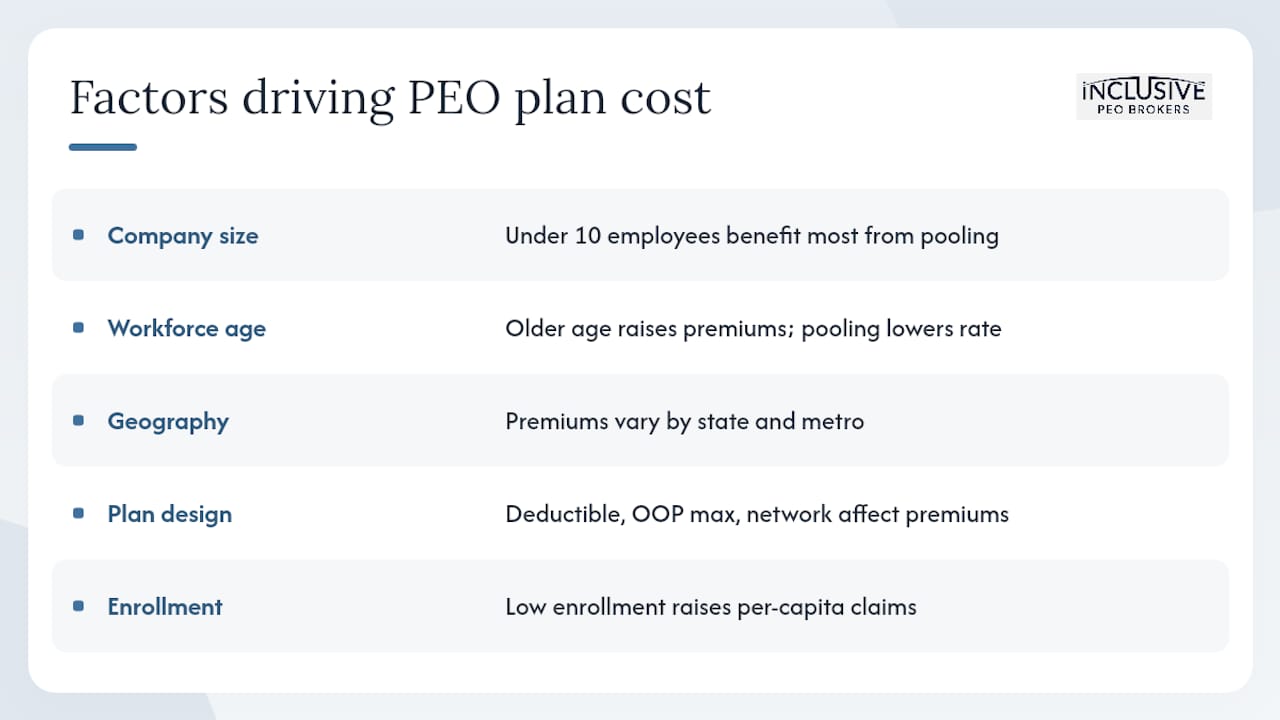
Company size and headcount: Smaller groups (under 10 employees) benefit most from PEO pooling because their standalone group options are limited and expensive. As headcount grows past 100, the premium advantage narrows and the admin fee becomes a larger share of the value equation.
Workforce age mix: Health insurance pricing is age-banded under the ACA. A workforce with a higher average age generates higher premiums, whether you’re in a PEO pool or not. The difference is that in a PEO pool, your older workforce is blended with younger workers from other client companies, which can lower your effective rate. Conversely, a very young workforce may pay more in a pool than it would on a standalone age-banded plan.
Geographic spread and state regulation: Premiums vary significantly by state and metro area. A company with employees in California, Texas, and New York faces three different carrier markets. PEOs with national master policies can simplify multi-state administration, but the underlying premium geography still affects cost.
Industry and NAICS classification: High-risk industries (construction, manufacturing, transportation) carry higher workers’ compensation rates. Some PEOs specialize in specific industries and offer better pricing for those NAICS codes; others price conservatively across the board.
Plan design: Deductible levels, out-of-pocket maximums, and network type (HMO, PPO, HDHP) drive premium differences as much as any other factor. A PEO offering only one or two plan designs may not match your workforce’s preferences, which affects voluntary enrollment rates and your effective cost per enrolled employee.
Enrollment levels: Low voluntary enrollment concentrates cost among sicker or older enrollees, raising per-capita claims and driving renewals higher. PEOs with large, diverse pools absorb this effect better than small standalone groups.
According to BLS data on civilian worker compensation, benefits generally constitute a significant share of total compensation costs for civilian workers. For a business paying $25/hour on average, that benchmark suggests budgeting approximately $7.25/hour per employee for total benefits, a useful anchor when modeling PEO costs against your current spend.
How to estimate your total employer cost under a PEO
The right comparison is total annual employer cost per enrolled employee across a multi-year horizon, not just the Year 1 premium. The KFF Employer Health Benefits Survey makes this point clearly: single-year premium snapshots miss renewal volatility, which is where PEO pooling either earns or loses its value.
Three worked scenarios illustrate how the math plays out.
Scenario A: 8-employee firm (very small)
- Current standalone single-coverage premium: $750/employee/month
- Employer contribution (80%): $600/employee/month
- Annual employer premium cost: $57,600 (8 employees)
- PEO-sponsored rate (pooled): $640/employee/month
- Employer contribution at 80%: $512/employee/month
- PEO admin fee: $150 PEPM × 8 = $1,200/month ($14,400/year)
- Annual employer cost under PEO: $49,152 + $14,400 = $63,552
- Net vs. current: +$5,952/year, but with HR admin, compliance, and workers’ comp bundled
Scenario B: 35-employee firm (mid-small)
- Current standalone premium: $720/employee/month; employer pays 80%
- Annual employer premium cost: $241,920
- PEO-sponsored rate: $660/employee/month; employer pays 80%
- Annual PEO premium cost: $221,760
- PEO admin fee: $130 PEPM × 35 = $4,550/month ($54,600/year)
- Annual employer cost under PEO: $221,760 + $54,600 = $276,360
- Net vs. current: +$34,440/year, but includes full HR stack and compliance offload
Scenario C: 90-employee firm (growing)
- Current standalone premium: $700/employee/month; employer pays 75%
- Annual employer premium cost: $567,000
- PEO-sponsored rate: $650/employee/month; employer pays 75%
- Annual PEO premium cost: $526,500
- PEO admin fee: $110 PEPM × 90 = $9,900/month ($118,800/year)
- Annual employer cost under PEO: $526,500 + $118,800 = $645,300
- Net vs. current: +$78,300/year, but the HR team hours recovered and compliance risk transfer may offset this depending on current HR staffing costs
These scenarios use illustrative rates. Your actual numbers depend on your carrier market, workforce demographics, and the specific PEO’s pool performance.
Pro Tip: Ask every PEO you evaluate for age-banded rate tables and three years of pool renewal history. The American Academy of Actuaries’ brief on 2025 premium changes is a useful benchmark for what “market trend” looks like in a given year.
What are the real benefits and tradeoffs of PEO health insurance?
The case for using a PEO for health benefits is strongest when your standalone options are thin, your HR capacity is limited, or your workforce is spread across multiple states. The case weakens when your workforce is unusually young and healthy, your headcount is large enough to self-insure, or you want granular control over plan design.
Benefits:
- Access to large-group plan designs (richer benefits, broader networks) that small employers cannot access directly
- Purchasing power that can reduce premium volatility, especially at renewal
- Bundled HR administration: open enrollment, employee communications, carrier billing, and compliance filings handled by the PEO
- Workers’ compensation access through PEO master policies, often at lower rates for qualifying industries
- ACA employer mandate compliance managed by the PEO, reducing your exposure to penalties
Tradeoffs:
- Less control over plan design: you choose from the PEO’s menu, not the open market
- Potential for premium markups if the PEO does not pass carrier rates through at cost
- Exit complexity: when you leave a PEO, employees may need to re-enroll in a new plan mid-year, and COBRA obligations transfer back to you
- Pool risk: if the PEO’s pool has a bad claims year, your renewal reflects it even if your own employees had low claims
- Misalignment for very healthy or young workforces that would fare better on age-banded standalone plans
The operational simplicity argument is real for companies under 50 employees. Running open enrollment, managing carrier billing, filing ACA forms, and handling COBRA for a 20-person team consumes HR hours that most small businesses cannot spare.
What should you ask a PEO before signing?
A thorough evaluation of PEO proposals for health insurance requires more than comparing Year 1 premiums. Use this checklist during your RFP process.
Documents to request:
- Age-banded rate tables for all health plan options (not just composite rates)
- Three years of pool renewal history, showing actual renewal percentages by year
- Complete PEPM fee schedule, itemized by service category
- Full list of included versus pass-through services, in writing
- Contract exit terms: notice period, carrier assignment rules, and COBRA transfer process
- COBRA administration procedures and any per-event fees
Questions to ask during vendor conversations:
- Does the PEO use composite or age-banded rating for your group? (Age-banded is more accurate for your workforce.)
- How does your pool’s claims experience influence my renewal, versus the broader pool?
- What network options are available in each state where my employees work?
- Are carrier premiums passed through at cost, or is there a markup?
- What happens to my employees’ coverage if I exit the PEO mid-year?
Red flags to watch for:
- Auto-renewal clauses without a required market audit or rate comparison
- Bundled quotes that make it impossible to isolate the admin fee from the premium
- No renewal history available, or history that covers fewer than two years
- Punitive exit clauses (penalties exceeding 90 days’ notice or carrier lock-in beyond the contract term)
- Vague answers about whether premiums are marked up
Are there better alternatives to PEO health insurance?
A PEO is not the right fit for every business. Four alternatives are worth understanding before you commit.
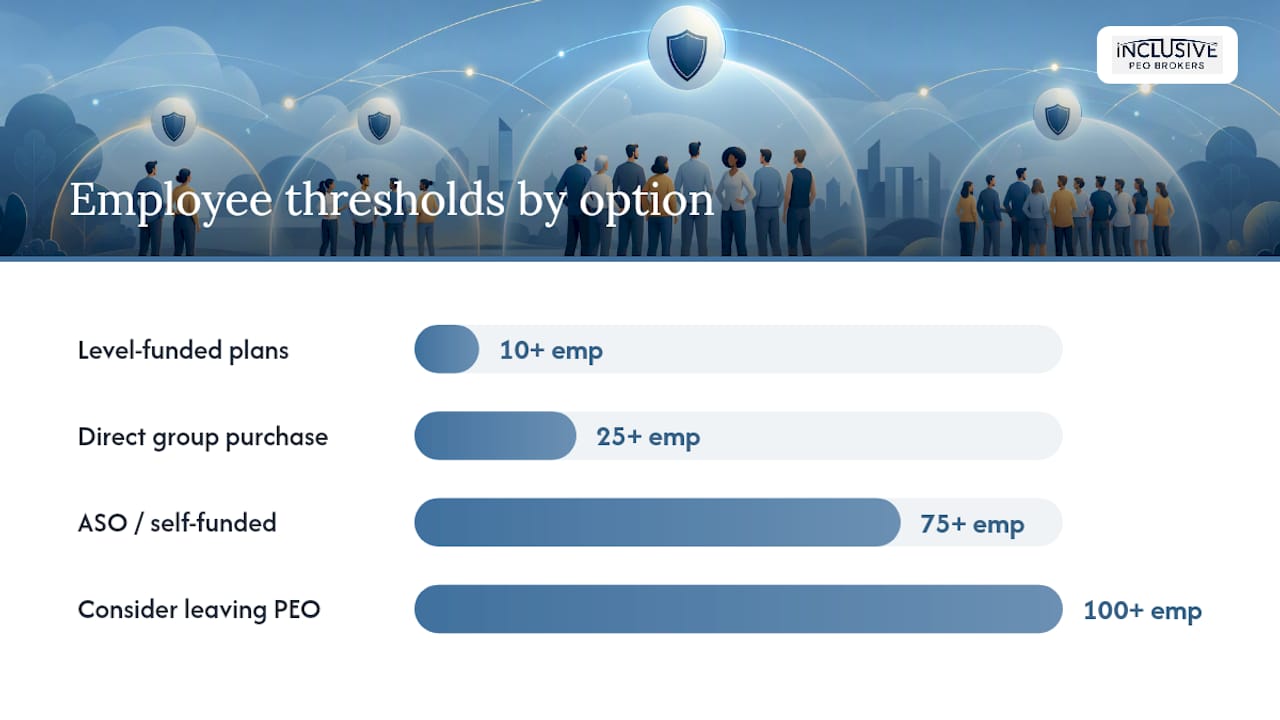
Direct group purchase (broker + carrier): You work with an independent broker to select a carrier and plan design directly. You control the plan, the network, and the contribution strategy. This works well for companies with 25+ employees, a stable workforce, and an HR team capable of managing open enrollment and compliance. The tradeoff is that you carry the full renewal risk and administrative burden.
Administrative Services Only (ASO) / self-funded: Your company funds claims directly and pays a third-party administrator (TPA) to process them. Premiums are replaced by a claims fund plus stop-loss insurance. This model suits employers with 75+ employees, favorable claims history, and the cash flow to absorb a bad claims month. The upside is significant cost savings in good years; the downside is exposure in bad ones.
Level-funded plans: A hybrid between fully insured and self-funded. You pay a fixed monthly amount that covers expected claims, stop-loss coverage, and administration. If claims come in below the funded level, you receive a refund. Level-funded plans have become accessible to employers with as few as 10 employees and often outperform fully insured premiums for healthy workforces.
Individual Coverage HRA (ICHRA): Instead of sponsoring a group plan, you reimburse employees tax-free for individual market premiums they purchase themselves. ICHRAs work well for remote-first companies with geographically dispersed workforces, or for businesses that want to cap their benefits spend precisely. The tradeoff is that employees bear the burden of selecting and managing their own coverage.
Key considerations for choosing among these options:
- Under 25 employees with limited HR capacity: PEO or level-funded plan
- 25–75 employees with stable workforce and some HR bandwidth: direct group or level-funded
- 75+ employees with favorable claims history: ASO/self-funded worth modeling
- Remote-first or geographically dispersed workforce: ICHRA or PEO with national network
- Desire for maximum plan design control: direct group or ASO, not PEO
Consider moving away from a PEO when your headcount crosses 100, your workforce’s claims history is consistently below the PEO pool average, or you want to offer a custom plan design that the PEO’s menu does not support.
How Inclusive PEO Brokers models outcomes for clients
The selection process itself carries a measurable cost. Most HR managers and business owners spend weeks collecting quotes, comparing proposals with inconsistent formats, and trying to isolate the admin fee from the premium line. Inclusive PEO Brokers reports that clients who use a brokered selection process save approximately 80 hours compared to running the evaluation independently, with an average cost saving of $634 per client and 133 successful implementations completed.
The modeling approach works in three steps:
- Collect current spend: Pull your current carrier invoice, employer contribution percentage, and total annual premium cost per enrolled employee.
- Request standardized PEO quotes: Ask each PEO for age-banded rate tables, a complete PEPM fee schedule, and three years of pool renewal history in a consistent format.
- Run a multi-year ROI comparison: Project Year 1 through Year 3 costs under each option, using the pool’s historical renewal rate as the trend assumption. Factor in HR hours recovered and compliance risk transfer as line items.
The brokered approach matters because PEOs do not quote in a standard format. One vendor bundles workers’ comp into the PEPM; another bills it separately. Without a side-by-side comparison built on the same assumptions, you are comparing apples to invoices.
For a concrete example of what this looks like in practice, the client success stories at Inclusive PEO Brokers document measured outcomes from completed implementations, including time saved, cost delta, and implementation timelines.
The part most cost guides get wrong about PEO health insurance
Most articles on PEO health insurance cost frame the question as: “Will a PEO lower my premiums?” That is the wrong question, and it leads HR managers and business owners to make decisions based on Year 1 premium snapshots that look favorable but deteriorate over time.
The right question is: “What is my total employer cost per enrolled employee over three years, and how does that compare to my best alternative?” The premium line is only one variable. The admin fee, the pool’s renewal history, the HR hours your team recovers, and the compliance risk you transfer are all part of the equation.
The other thing most guides understate is the exit cost. Leaving a PEO mid-year can force your employees through a re-enrollment process, trigger COBRA obligations that transfer back to you, and expose gaps in your HR infrastructure that the PEO was quietly covering. That is not an argument against PEOs. It is an argument for going in with a clear exit strategy and contract terms that protect you.
For small businesses under 30 employees with no dedicated HR staff, a well-matched PEO is often the most practical path to large-group benefits and compliance coverage. The key word is “well-matched.” The PEO that fits a 12-person tech company in Austin is not the same one that fits a 45-person manufacturing firm in Ohio. The selection process deserves the same rigor as any other major vendor decision.
How Inclusive PEO Brokers helps you find the right fit
Sorting through PEO proposals is time-consuming, and the cost of choosing the wrong one compounds every year at renewal. Inclusive PEO Brokers takes the comparison work off your plate: collecting standardized quotes, running side-by-side cost models, and matching your business to PEOs that fit your industry, headcount, and benefits goals.

Clients who work with Inclusive PEO Brokers save an average of 80 hours in the selection process and report an average cost saving of $634. With 133 completed implementations across industries, the process is built around your specific numbers, not a generic recommendation. Whether you are evaluating a PEO for the first time or reconsidering your current arrangement, the first-time PEO selection service walks you through every step, from pulling your current spend to reviewing final proposals. Ready to see what the right PEO could mean for your benefits cost? Start the process here.
Sources
These are the primary data sources behind the cost figures and benchmarks in this guide. Pull them directly when building your own assumptions.
- 2024 Employer Health Benefits Survey | KFF
- Industry research & data | NAPEO
- About the Affordable Care Act | HHS
- Compensation costs for civilian workers averaged $46.14 per hour worked in March 2024 | BLS
.svg)
Seeking a different solution? Meet Your Business Needs